Editorial charts Preview
Explain a trend with line charts, timed notes and a highlighted period. Add your data, headline and source credit.
1–3 series · 12 or 18 secondsExplain a trend, follow a ranking or reveal a number. Make an animated chart and download an MP4 or GIF. Free, with no account or watermark.
Explain a trend with line charts, timed notes and a highlighted period. Add your data, headline and source credit.
1–3 series · 12 or 18 secondsCompare changing values and rankings. Paste a spreadsheet or import CSV, then watch bars move on a fixed scale.
2–8 series · 5, 10 or 15 secondsReveal a value with rolling digits or show a before-and-after change. Set your numbers, currency, caption and pace.
One value or a comparison · 2, 5 or 10 secondsA line tells you what changed. An annotation helps explain what happened. Give each turning point a reading pause, and keep the source with the chart.
Start with three historical studies from NASA, the US Bureau of Labor Statistics and the World Bank. Each includes the original values, method and limits.
Explore the editorial lab Available to try · downloadable clips, not interactive article embeds.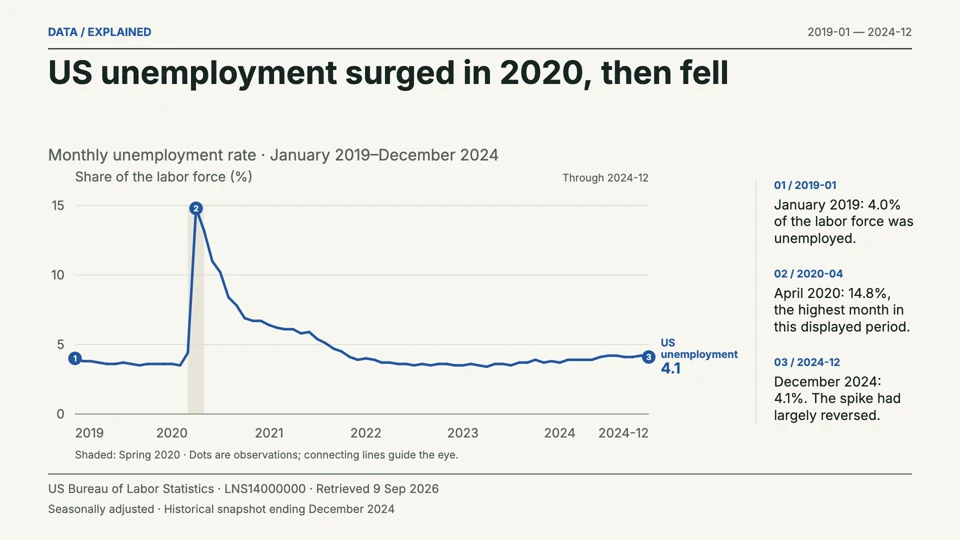 The unemployment spike and recovery BLS · monthly, seasonally adjusted · 2019–2024
Every study: editable chart, MP4, GIF, source CSV and attribution notes.
Six bar chart races built from World Bank data. Compare five selected countries, inspect the values and adapt an example to your own question.
Explore chart race examples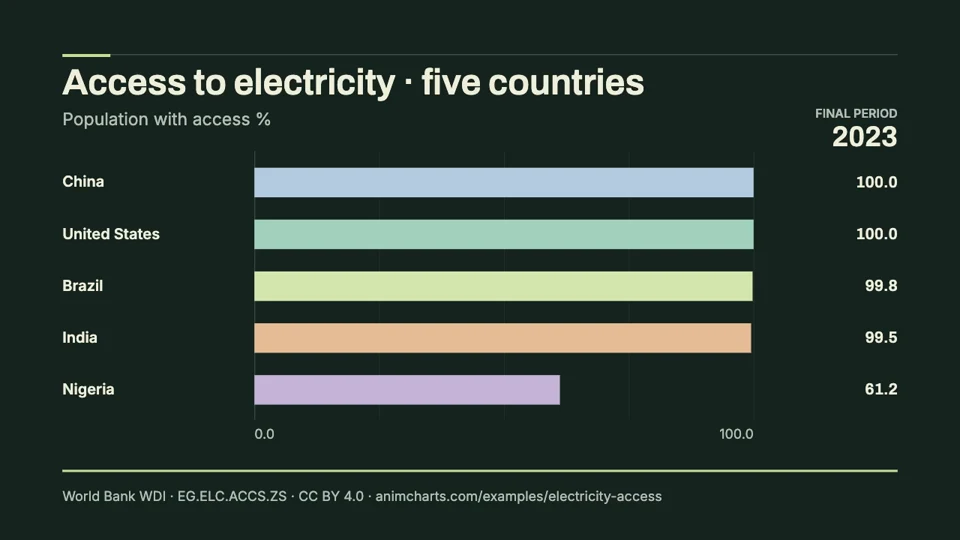 Access to electricity Five selected countries · 2000–2023
Historical comparisons, with sources and method. These are not complete world rankings.
All three tools export free, silent H.264 MP4 at 30 frames per second. Choose 720p or 1080p. Every clip includes a final hold to keep the ending values readable. Save a project file to reopen your data and settings later.
1080p exports: 1920 × 1080 landscape, 1080 × 1080 square or 1080 × 1920 portrait.
Animated GIFs loop at 20 fps: 960 × 540 landscape, 960 × 960 square or 540 × 960 portrait. GIF files are capped at 32 MB; MP4 is better for dense charts and longer clips.
MP4 export needs a browser with H.264 encoding support. Desktop Chrome, Firefox and WebKit exports have been tested; physical phones have not. GIF export uses a browser worker. Audio and transparent backgrounds are not supported. Each editor shows its input and duration limits.
AnimCharts is a collection of free animated-data tools by SupaMakers. Make a useful video, inspect the data and download the result.
Your values, captions and files are processed in your browser. We use Plausible for aggregate visits and tool events; your chart data is not included.
Public examples credit their original data providers and explain the transformations. Chart races interpolate between supplied values; editorial lines reveal the supplied observations. In both, motion does not create new measurements.
Meet the makers