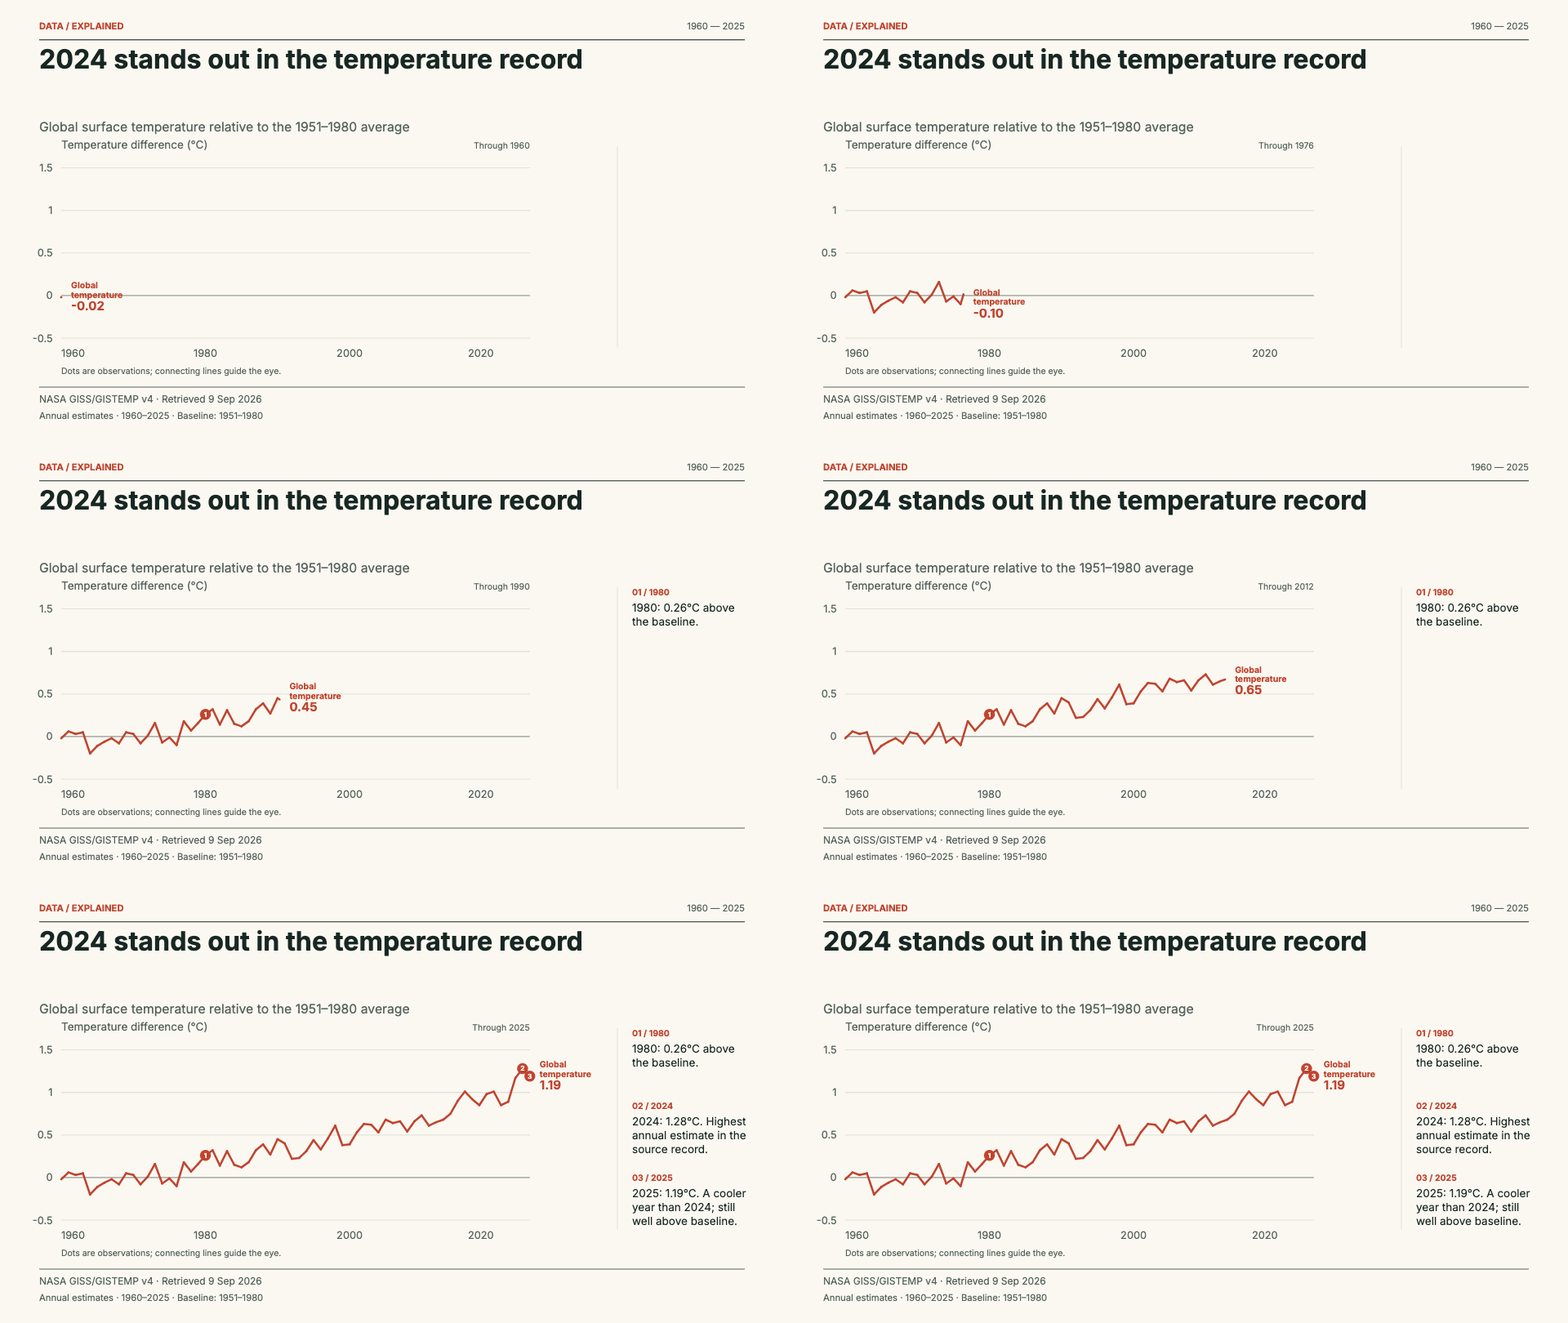
The J-D column is the published annual land-ocean temperature anomaly in degrees Celsius. Every year from 1960 through 2025 is retained. No smoothing or rebasing. The record-high check uses all complete annual estimates from 1880 onward.
These are estimates subject to revision. The baseline is 1951–1980, not preindustrial. A single year does not establish a long-term warming threshold; uncertainty intervals are not drawn. Incomplete 2026 is excluded.
GISTEMP Team (2026), GISS Surface Temperature Analysis, version 4. NASA GISS. Accessed 2026-09-09. Lenssen et al. (2024), A GISTEMPv4 observational uncertainty ensemble, doi:10.1029/2023JD040179.
NASA GISS requests source credit and citation; original chart drawn from published numerical data. No NASA logo or endorsement. Reuse guidance · Research paper
Read the original data table
2024 stands out in the temperature record — original observations
Year
Global temperature
1960
-0.02
1961
0.06
1962
0.03
1963
0.05
1964
-0.2
1965
-0.11
1966
-0.06
1967
-0.02
1968
-0.08
1969
0.05
1970
0.03
1971
-0.08
1972
0.01
1973
0.16
1974
-0.07
1975
-0.01
1976
-0.1
1977
0.18
1978
0.07
1979
0.16
1980
0.26
1981
0.32
1982
0.14
1983
0.31
1984
0.15
1985
0.12
1986
0.18
1987
0.32
1988
0.39
1989
0.27
1990
0.45
1991
0.4
1992
0.22
1993
0.23
1994
0.31
1995
0.44
1996
0.33
1997
0.46
1998
0.61
1999
0.38
2000
0.39
2001
0.53
2002
0.63
2003
0.62
2004
0.53
2005
0.68
2006
0.64
2007
0.66
2008
0.54
2009
0.66
2010
0.73
2011
0.61
2012
0.65
2013
0.68
2014
0.75
2015
0.9
2016
1.01
2017
0.92
2018
0.85
2019
0.98
2020
1.01
2021
0.85
2022
0.89
2023
1.17
2024
1.28
2025
1.19
US unemployment surged in 2020, then fell
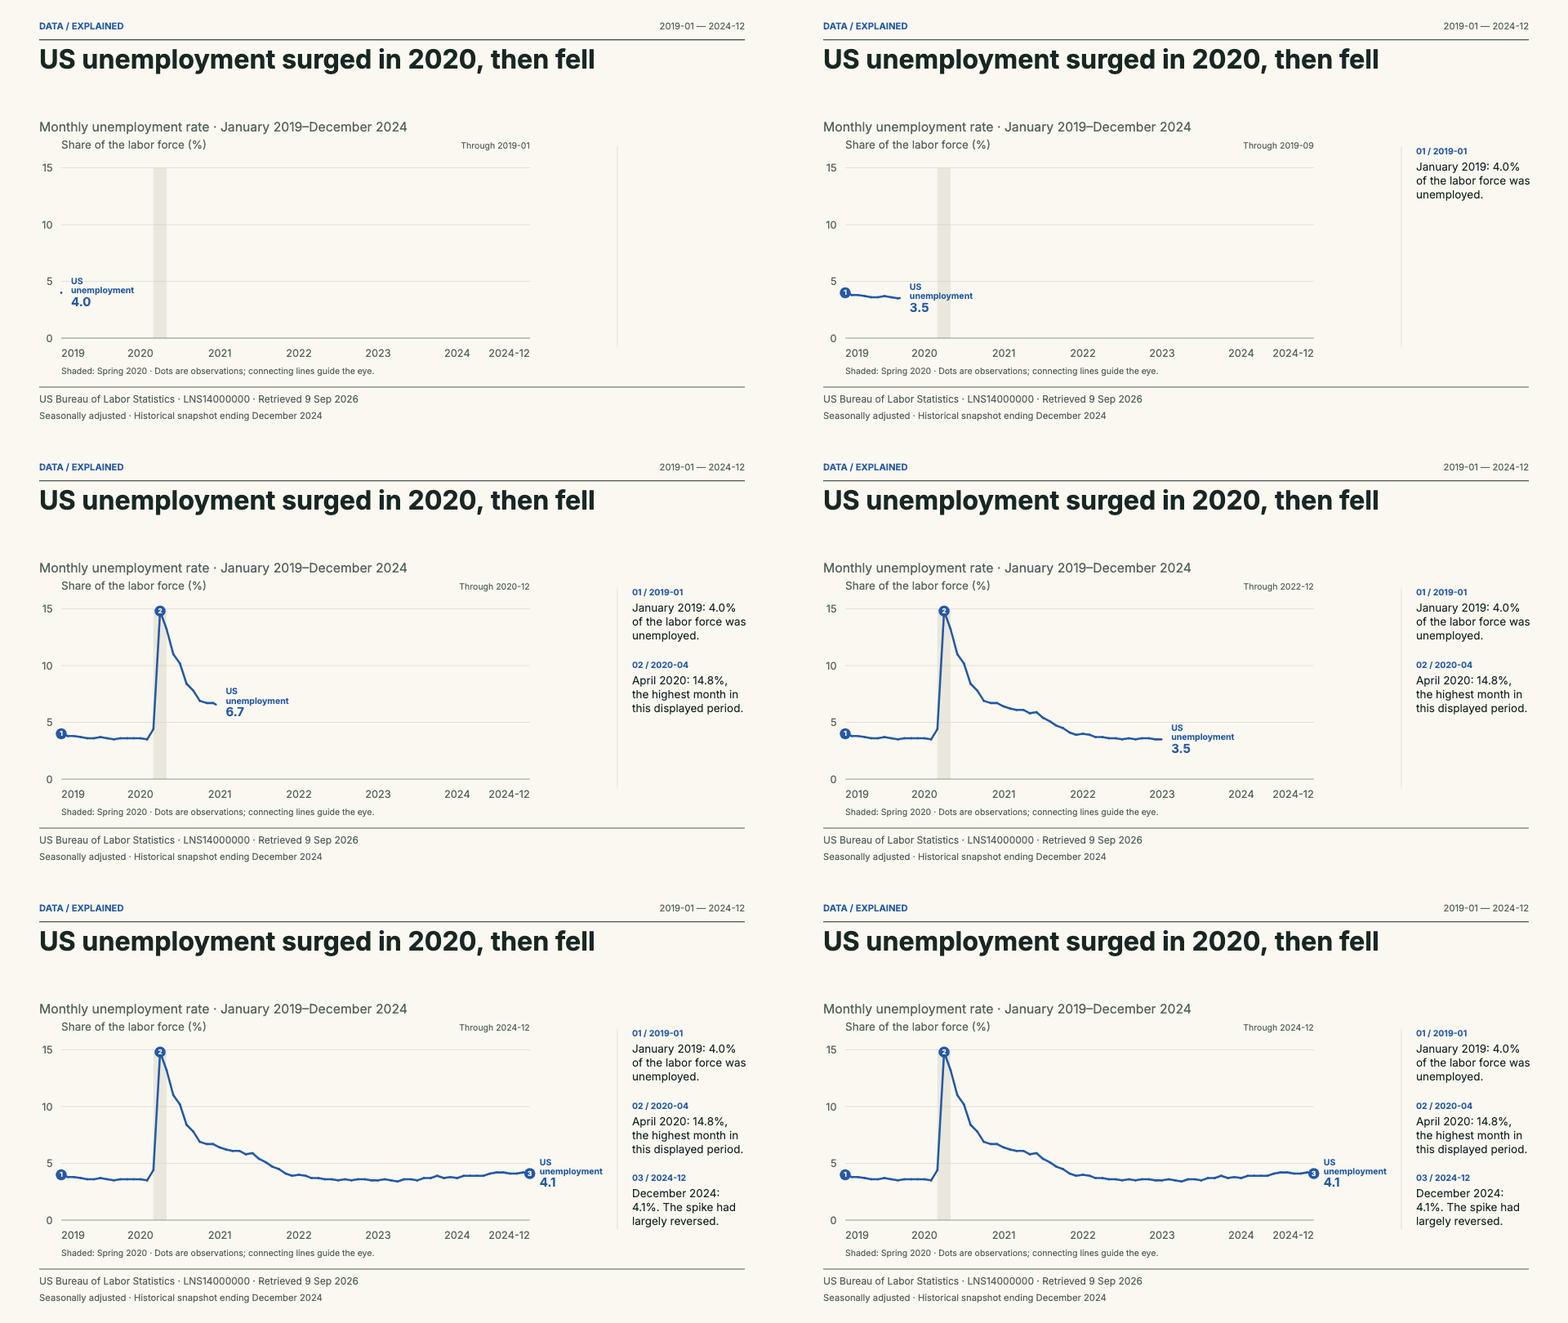
The seasonally adjusted US unemployment rate rose to 14.8% in April 2020 and was 4.1% in December 2024.
All 72 monthly values from the API are retained in chronological order, without averaging or interpolation of missing observations. Monthly dates are positioned at the first day of each month. This is the published seasonally adjusted rate, not annual averages.
The unemployment rate is a share of the labor force, not of all residents. Seasonal adjustments can revise historical values. This deliberately historical example ends in 2024 and does not describe the current labor market. Connecting segments are visual guides, not daily observations.
US Bureau of Labor Statistics, Current Population Survey, series LNS14000000 (seasonally adjusted unemployment rate), January 2019–December 2024. Retrieved 2026-09-09.
BLS numerical publications are public domain; BLS requests source credit. Reuse guidance
Read the original data table
US unemployment surged in 2020, then fell — original observations
Date
US unemployment
2019-01
4.0
2019-02
3.8
2019-03
3.8
2019-04
3.7
2019-05
3.6
2019-06
3.6
2019-07
3.7
2019-08
3.6
2019-09
3.5
2019-10
3.6
2019-11
3.6
2019-12
3.6
2020-01
3.6
2020-02
3.5
2020-03
4.4
2020-04
14.8
2020-05
13.2
2020-06
11.0
2020-07
10.2
2020-08
8.4
2020-09
7.8
2020-10
6.9
2020-11
6.7
2020-12
6.7
2021-01
6.4
2021-02
6.2
2021-03
6.1
2021-04
6.1
2021-05
5.8
2021-06
5.9
2021-07
5.4
2021-08
5.1
2021-09
4.7
2021-10
4.5
2021-11
4.1
2021-12
3.9
2022-01
4.0
2022-02
3.9
2022-03
3.7
2022-04
3.7
2022-05
3.6
2022-06
3.6
2022-07
3.5
2022-08
3.6
2022-09
3.5
2022-10
3.6
2022-11
3.6
2022-12
3.5
2023-01
3.5
2023-02
3.6
2023-03
3.5
2023-04
3.4
2023-05
3.6
2023-06
3.6
2023-07
3.5
2023-08
3.7
2023-09
3.7
2023-10
3.9
2023-11
3.7
2023-12
3.8
2024-01
3.7
2024-02
3.9
2024-03
3.9
2024-04
3.9
2024-05
3.9
2024-06
4.1
2024-07
4.2
2024-08
4.2
2024-09
4.1
2024-10
4.1
2024-11
4.2
2024-12
4.1
Life expectancy followed different paths in the US and Japan
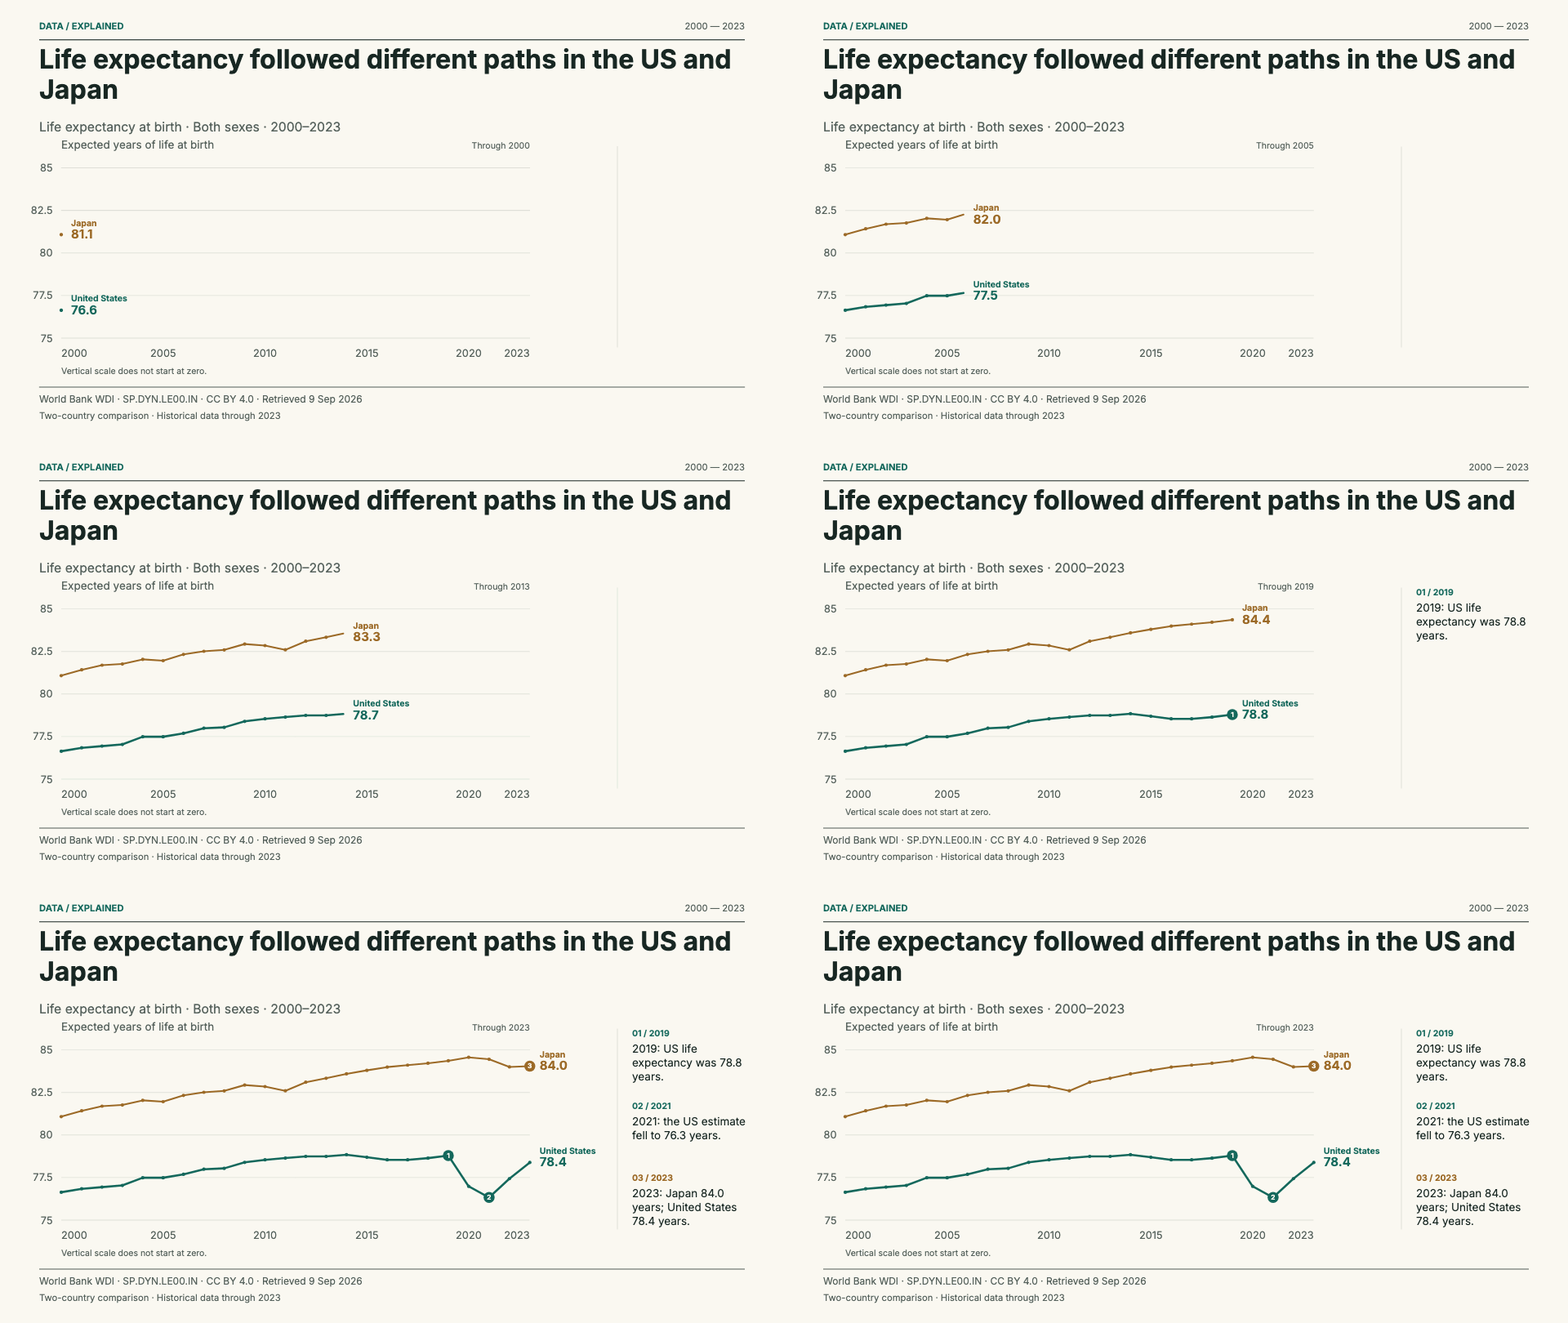
In 2023, the retrieved World Bank estimates are 84.0 years for Japan and 78.4 for the United States. The US value fell from 78.8 in 2019 to 76.3 in 2021 before recovering.
All 24 annual observations for each country are retained at full API precision. Only displayed labels are rounded. Both lines share a fixed scale across the entire clip. The vertical scale does not begin at zero and is explicitly disclosed.
Period life expectancy describes expected years under that period’s mortality rates; it is not a forecast of an individual’s lifespan. The chart does not establish causes. These two countries are not a global ranking. The historical selection ends in 2023 even though newer observations may exist.
World Bank, World Development Indicators, SP.DYN.LE00.IN. Underlying sources: UN World Population Prospects, national statistical offices and Eurostat. CC BY 4.0. Retrieved 2026-09-09. Adaptation: two countries and 2000–2023 selected; labels rounded to one decimal.
CC BY 4.0, as stated on the indicator page. Reuse guidance
Read the original data table
Life expectancy followed different paths in the US and Japan — original observations
Year
United States
Japan
2000
76.6365853658537
81.0760975609756
2001
76.8365853658537
81.4163414634146
2002
76.9365853658537
81.6907317073171
2003
77.0365853658537
81.76
2004
77.4878048780488
82.030243902439
2005
77.4878048780488
81.9551219512195
2006
77.6878048780488
82.3219512195122
2007
77.9878048780488
82.5070731707317
2008
78.0390243902439
82.5875609756098
2009
78.390243902439
82.9314634146342
2010
78.5414634146342
82.8426829268293
2011
78.6414634146341
82.5912195121951
2012
78.7414634146342
83.0960975609756
2013
78.7414634146342
83.3319512195122
2014
78.8414634146341
83.5878048780488
2015
78.690243902439
83.7939024390244
2016
78.5390243902439
83.9848780487805
2017
78.5390243902439
84.099756097561
2018
78.6390243902439
84.2109756097561
2019
78.7878048780488
84.3563414634146
2020
76.9804878048781
84.56
2021
76.3292682926829
84.4456097560976
2022
77.4341463414634
83.9963414634146
2023
78.3853658536585
84.0412195121951
Built by SupaMakers to make useful data easier to explain and reuse. Source organizations have not endorsed these charts.