Use the MP4 with controls and a complete poster image. Keep context, source links and the underlying values beside the figure. Use the large-text portrait composition for a narrow article column.
For WordPress, upload the MP4 and poster in the Video block. For other systems, use their native media tools and check the final page.
In a newsletter
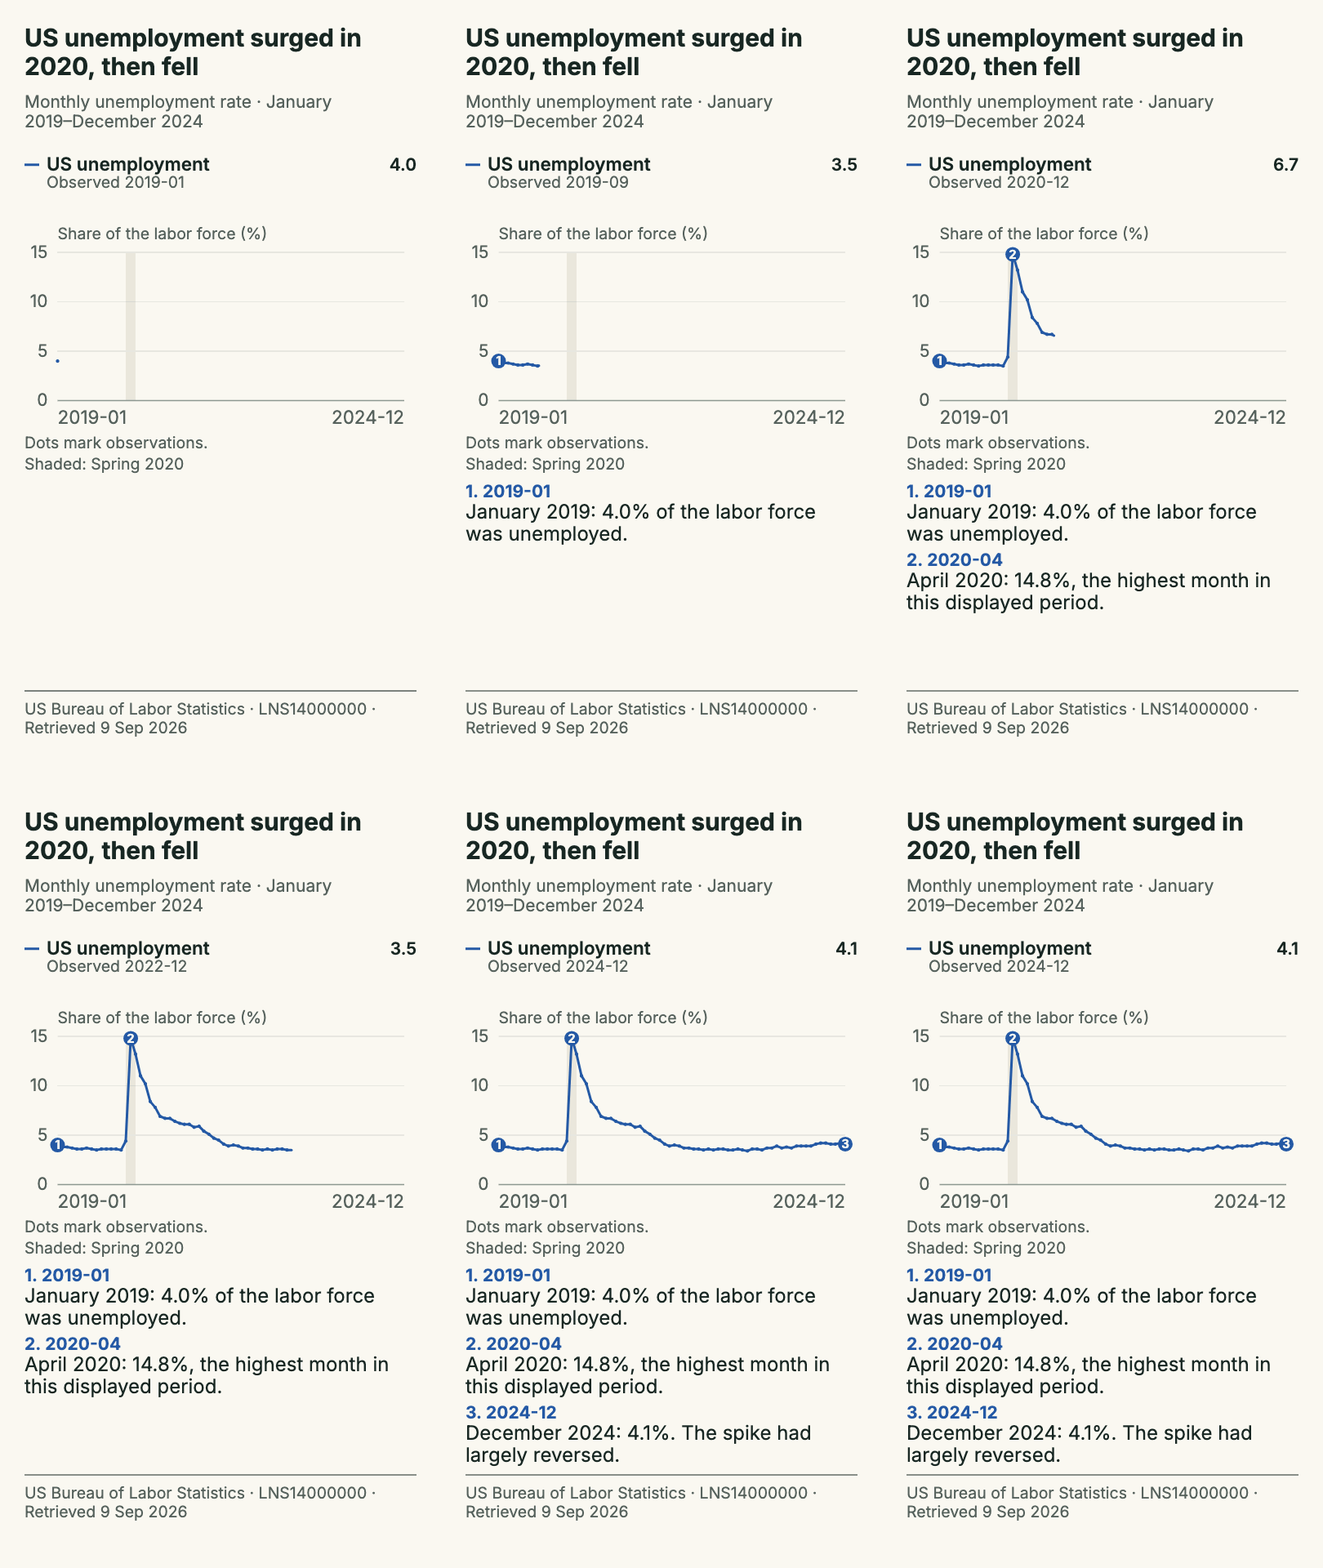
Use the complete still linked to your article. The story remains visible even when animation is unavailable. Keep a text caption and source credit outside the image for readers who block remote images.
Replace the draft’s local file paths with your uploaded HTTPS URLs. Preview in your email platform and send yourself a test before distribution. Outlook animation settings can leave only the first frame visible; don’t use an unfinished opening frame as the fallback.
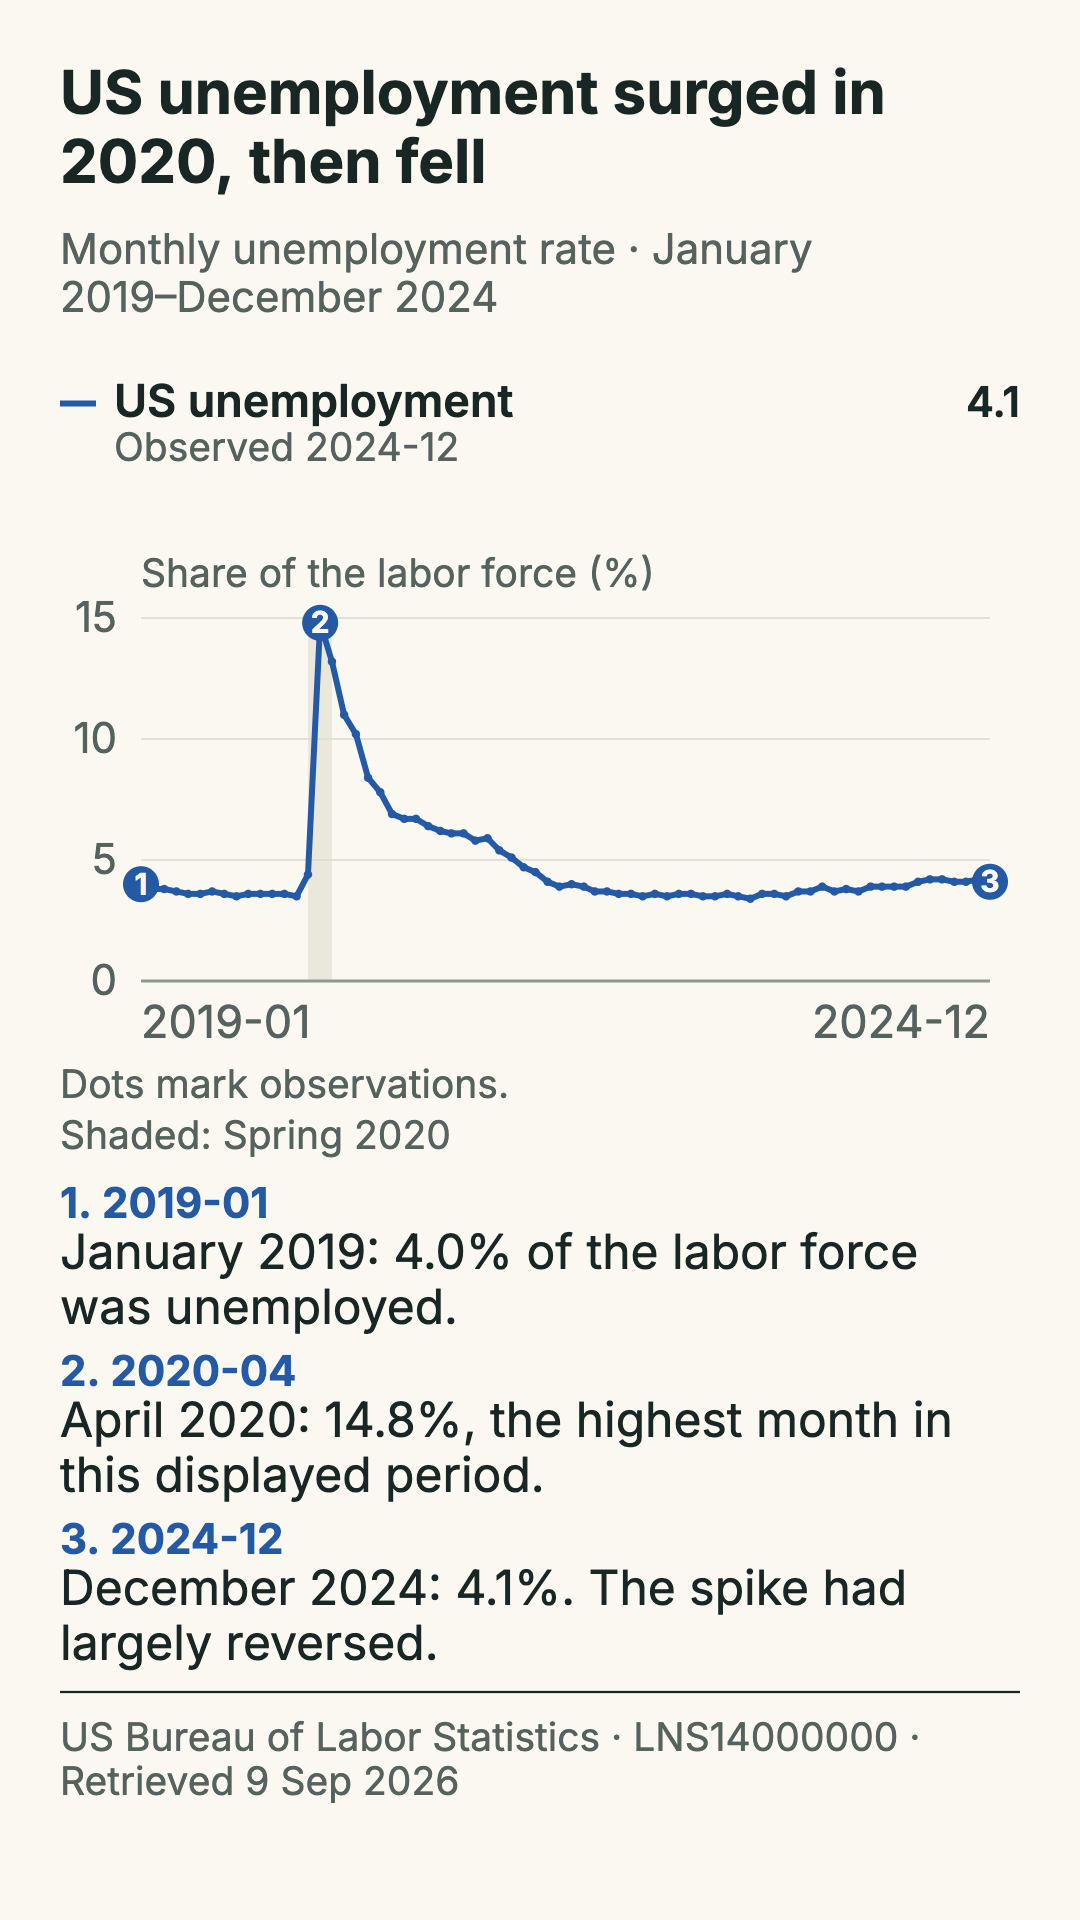
US unemployment rose sharply in 2020, then fell.
The seasonally adjusted US unemployment rate was 4.0% in January 2019. It reached 14.8% in April 2020 and stood at 4.1% in December 2024—a decline of 10.7 percentage points from the April peak in this historical snapshot.
The rate measures unemployed people as a share of the civilian labor force. It is not the percentage of the whole population without a job. The line connects monthly observations; it does not supply daily measurements or establish a cause for each change.
This example retains all 72 monthly observations from January 2019 through December 2024. The March–May 2020 shading marks the selected period. BLS can revise historical seasonally adjusted values; check the source before using the figures in a current report.
Source: US Bureau of Labor Statistics, Current Population Survey, series LNS14000000. Snapshot retrieved September 9, 2026.
Choose something you genuinely plan to publish. Set your data, headline, source and one useful note. Export it and place it in your normal writing tool. Stop wherever you would normally stop.
Record what worked, what needed help and whether you would use the result. Publishing, feedback and maker credit are optional.